 With Easter weekend upon us, it seemed appropriate to take a look at what how many Americans currently consider themselves believers, according to the latest American Religious Identification Survey (ARIS), released last month. Sadly, most religious groups in USA appear to have lost ground since 1990:
The percentage. of people who call themselves in some way Christian has dropped more than 11% in a generation. The faithful have scattered out of their traditional bases: The Bible Belt is less Baptist. The Rust Belt is less Catholic. And everywhere, more people are exploring spiritual frontiers — or falling off the faith map completely.Here's a look at the actual numbers from the American Religious Identification Survey in 2008:Among the key findings in the 2008 survey:
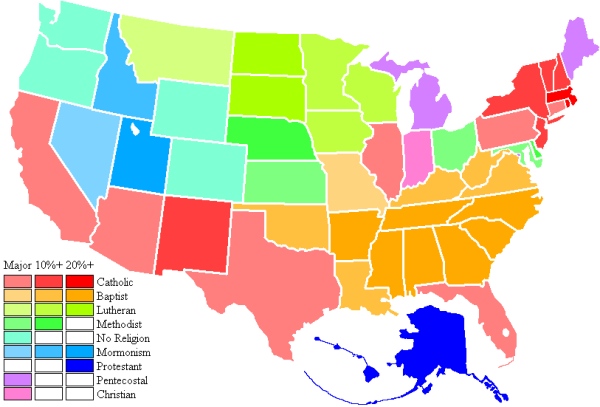
- So many Americans claim no religion at all (15%, up from 8% in 1990), that this category now outranks every other major U.S. religious group except Catholics and Baptists.
- Catholic strongholds in New England and the Midwest have faded as immigrants, retirees and young job-seekers have moved to the Sun Belt. While bishops from the Midwest to Massachusetts close down or consolidate historic parishes, those in the South are scrambling to serve increasing numbers of worshipers.
- Baptists, 15.8% of those surveyed, are down from 19.3% in 1990. Mainline Protestant denominations, once socially dominant, have seen sharp declines: The percentage of Methodists, for example, dropped from 8% to 5%.
- The percentage of those who choose a generic label, calling themselves simply Christian, Protestant, non-denominational, evangelical or "born again," was 14.2%, about the same as in 1990.
- Jewish numbers showed a steady decline, from 1.8% in 1990 to 1.2% today. The percentage of Muslims, while still slim, has doubled, from 0.3% to 0.6%. Analysts within both groups suggest those numbers understate the groups' populations.

And a map of how denominations are distributed across states:

For the first time, 15% of the population now claims "None" for their religion. Only Catholics and Baptists are larger in size. Among the "Nones", upbringing appears to play a critical role:
A closer look at the "Nones" — people who said "None" when asked their religious identity — shows that this group (now 15% of Americans, up from 8% in 1990) opts out of traditional religious rites of passage:
If these figures are correct, it implies that religion is losing market-share in the US in terms of a percentage of the population. What these numbers don't tell you is that there has been an absolute growth of about 25 million new believers (an increase of 22 million Christians plus 3 million non-Christians) in the US since 1990. While there has been growth among those who identify themselves as "None", there has also been substantial numerical growth among believers of almost all types as well.
- 40% say they had no childhood religious initiation ceremony such as a baptism, christening, circumcision, bar mitzvah or naming ceremony.
- 55% of those who are married had no religious ceremony.
- 66% say they do not expect to have a religious funeral.
"Your parents may decide for you on baptism and your spouse has a say in your wedding, but when people talk about dying, they speak for themselves," says Kosmin.
He expects the number of Nones to continue to grow as each generation begets more.
Some questions this survey data raises:
- What is the decline in the overall levels of church attendance since 1990?
- Would some of those who classify themselves as "None" have classified themselves as Christian in 1990?
- Of the 15% who are "None", what percentage is atheist vs. agnostic vs. something else?
- How much of the changes in belief are due to changes in population growth and immigration?
- What is the impact of social mobility (people moving from one region of the US to another) on religion? Has there been any change in this mobility between 1990 and 2008?
- What growth or shrinkage has there been among those who attend church on a weekly basis since 1990, both on an absolute and percentage basis? These numbers are more likely more indicative of actual levels of belief in both time periods.
1 comment:
Can the budding subfield "The Economics of Religion" explain this? If so (even partially), sounds like a great dissertation idea!
Although if you do choose this topic (or any religious topic), you should probably avoid normative judgments like labeling this a "sad" development.
Post a Comment