I am definitely a visual thinker and think this is a great tool for helping others to understand this technique of statistical analysis. Nicely done!
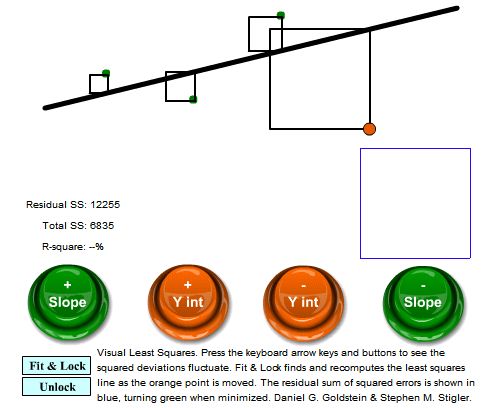
Back when the DSN editor was a student at Chicago, he learned Statistics and History of Statistics from Steve Stigler, who proposed a visual demonstration of least squares regression. Together they came out with a now-obsolete Mac version. Today, DSN is proud to announce a version that will run on any browser that does Flash.
The demonstration should be self-explanatory to anyone who understands simple regression, and if not, might suffice as a tutor. And if not, there is always the linear regression article in Wikipedia.
Hattip to Andrew Gelman.
No comments:
Post a Comment